
By Gretchen Teague and Landon Summers
Let’s begin by dispelling the rumor that theatre folk don’t do mathematics. We do, in fact, use math and scientific reasoning on a regular basis for budgeting and in the design and construction of sets. But it doesn’t stop there.
Mathematically-minded students like Landon Summers often make their way into theatre class—this makes sense in an IB context because one of the tenets of the IB Diploma Programme (DP) is about the student who finds balance among interests. In Landon’s case, his mathematical contribution had a direct and positive impact on the successes of our theatre class performances.
Artists thrive on the collaboration between diverse perspectives—Yo-Yo Ma told the Huffington Post in 2017.
The “edge effect” in ecology occurs at the border where two ecosystems—for example the savannah and forest—meet. At that interface, where there is the least density and the greatest diversity of life forms, each living thing can draw from the core of the two ecosystems. That is where new life forms emerge.
Playing for laughs
The overall goal of this particular theatre class was to create engaging and accessible theatre performances. Our chosen style of theatre were short, one-act performances called “readers’ theatre”.

Kristen Lawson, IB theatre and DP Class of 2018
The readers’ performance technique is a 30-minute performance prepared from prose, poetry, or a play with a minimum of three performers. Words must be read from books or binders during the performance and movement is limited. The result is a very stylized performance which utilizes narration in conjunction with choral speaking and unison movement.
Our class worked hard to create engaging and accessible performances, especially as this form of performance was unfamiliar to most of our audience members. They also played to their strengths by pursuing a piece that would showcase the physical comedy skills of the actors, appealing to our aesthetic as performers, and inducing laughter in our audience.
What’s funny about that?
Anecdotally, the students observed a consistent reaction from the audience at specific moments of the performance. But we wanted something more than anecdote; was there a way to quantify the consistent and inconsistent responses we were getting from our audiences? This is where Landon’s mathematics skills came to the fore.

From left to right: Kirstin Hildebrand, IB theatre Class of 2018; Parker Bailey, IB theatre and DP Class of 2018; Kelly Gonzalez, IB theatre and Class of 2017
Landon proposed gathering both qualitative and quantitative data for analysis by running test performances with test audiences. Students were assigned to monitor the responses of specific audience members, counting the number of times they laughed and what they were laughing in response to, followed by short interviews after the performance.
A new Broadway show goes through months of staged readings, out of town previews, and New York previews. In a conversation with Robert Westenberg (Drama Desk Award winner for Prince Charming/Wolf) about his experience with the original Broadway production of Into the Woods, he described how Sondheim would come in with a new song, a new verse, or a new scene almost every day during preview performances. The idea is that through the audience feedback, either reaction in the moment with laughs or applause or after show interviews, the show could be revised until it hits with all audience members.
Two of the DP theatre course assessments involve getting feedback from audience members and peer mentors. Our laughter project enabled DP theatre students to experience that feedback loop together as a group. They processed the data as a collective and judged whether to make any changes to the performance. Digesting the post-performance audience interview feedback together helped the students develop better coping mechanisms as they go into both solo and collaborative projects later in the course and beyond.
Running the numbers
Landon came across advanced statistics while reading for his DP mathematics studies, his interest was piqued when reading about mean and standard deviation (SD). Landon explained standard deviation to the DP theatre class like this:
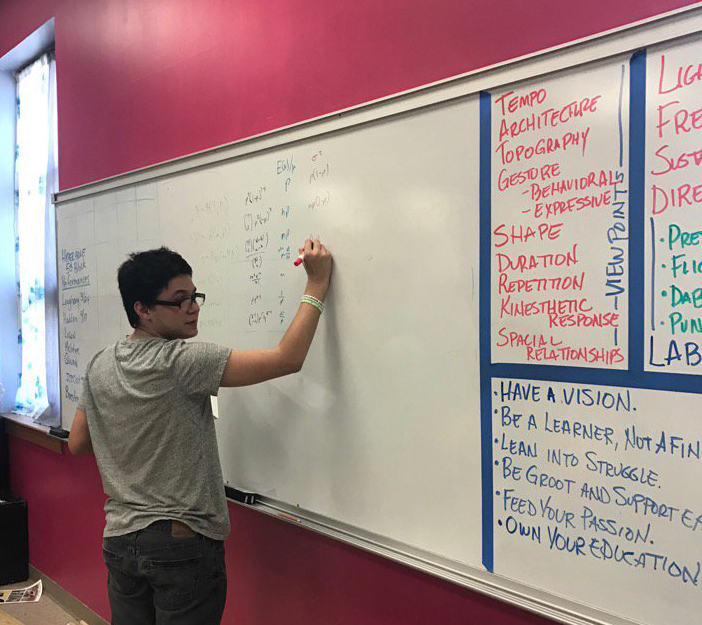
“Let’s pretend the data we are looking at is the number of cream puffs a bakery makes every month. The mean is the average number of cream puffs sold every month. This can be good for monetary purposes, but what really fascinated me was the data statistic known as “standard deviation”. This can also be known as an error, but no matter what the terminology is, a standard deviation represents the amount of variation in a spread of data.
“A bell curve represents all the data we have, such as all the cream puffs sold over the time recorded. Let’s pretend our cream puffs follow this graph. If you move left and right from the centre of the bell curve to -1 SD and +1 SD you’ll see that for roughly 68% of the period measured they sold between 85-115 cream puffs. This is good for predicting income, and budgeting. If we continue to -2 and +2 SD, we see that 95% of the data lies in this area. If we stretch to -3 and +3 SD, we see 99% of the data, and the rest is on the outside.”
Using test audiences and monitoring their responses, data became easier to record and calculate with practice. Students identified the SD areas and worked on performance improvements to get more laughs from those parts of the performance. The final average was roughly 72 laughs per performance. And by laugh, this is when three or more people laughed at once, not just one. In a 27-minute performance, we averaged two to three laughs every minute.
Actor and DP graduate Class of 2017, Kelly Gonzales, said, “Our piece was powered by the laughs of the audience. I know this sounds silly, but this is legitimately how I began seeing the piece, and it worked really well! Because of this, tracking the scenes that created the highest numbers of laughs, we found better ways to pause for laughter, and how to adjust scenes to gain more laughs based on the others. This also allowed us to see how every individual performance differed on our energy level.”
Reflection
Kelly also said, “I became hyperaware of how critical it was to have a reactive and laughing audience to make the show so much better. The more laughs began to equate to the level of energy, which brought even more laughs, which is why we performed so well. It was as if our energy and happiness with the piece was predicated on the energy and happiness of the audience, and vice versa”.
Collyn Riley, researcher and DP Graduate Class of 2018 noticed several different factors that caused the audience(s) to laugh. “Personally, I laughed because of how overly dramatic a lot of the actors were,” she remembered, “It reminded me of how you make silly faces at a newborn baby and it usually results in them laughing.—
Overall, the collaborative and data collection process could use some tweaking, but the resulting learning was sustained and strong. Kelly added “I strongly encourage this methodology in rehearsal to prepare for an upcoming show”.
Gretchen Teague (Ed.D) is an IB theatre teacher and MYP coordinator at Central High School, Springfield, MO. Landon Summers is a DP Graduate Class of 2017 from Central High School.
References:
- Blythe, Peter & Joseph, Peter & Urban, Paul & Martin, David & Haese, Robert & Haese, Michael. (2006). Mathematics for the international student: Mathematics HL (Options). Marleston, Australia: Haese Publication.
- Catmull, E., & Wallace, A. (2015). Creativity, Inc: Overcoming the unseen forces that stand in the way of true inspiration. NY: Random House Inc.
- Davis, Wade. (2009). The Wayfinders: Why Ancient Wisdom Matters in the Modern World. Toronto, Canada: House of Anansi Press.
- Giardina, C. (2016, March 4). ‘Zootopia’: Ginnifer Goodwin’s rabbit was never supposed to be the star. Hollywood Reporter. Retrieved from http://www.hollywoodreporter.com/behind-screen/zootopia-ginnifer-goodwins-rabbit-was-872691
- Interpretation of Evaluation Results. Psychological Assessment Resources, Inc.
- Ma, Y. (2017). Behind the Cello. Huffington Post. Retrieved March 16, 2017, from http://www.huffingtonpost.com/yoyo-ma/behind-the-cello_b_4603748.html
- Missouri State High School Activities Association. (2016). Speech, debate, and drama manual. Retrieved from https://www.mshsaa.org/resources/pdf/1617SDTManual_v2.pdf